In October, Lockton examined an important question for commercial insurance buyers: Why are liability rates continuing to rise? (opens a new window)
Six months later, that question remains relevant. Although Jan. 1, 2024, casualty reinsurance renewals were orderly, reinsurers and insurers are looking closely at returns on capital. Liability loss rates continue to pose serious concerns for insurers, and buyers continue to see pricing go up.
Here are two big trends that continue to influence liability insurance pricing.
Economic inflation
In February 2023, overall inflation — as measured by the Bureau of Labor Statistics’ Consumer Price Index (CPI) (opens a new window) — was at 6.0% year over year. 12 months later, it was down to 3.2%.
The Federal Reserve has made significant progress in fighting inflation, which peaked during the pandemic at 9.1% in June 2022. Still, it is far from defeated and remains well above the Fed’s target of 2%.
Moreover, inflation hasn’t fallen steadily. After dropping as low as 3.0% in June, it ticked upward later in 2023 amid economic growth and rises in the cost of labor and services. This suggests that the path to consistently lower prices may be longer and bumpier than expected.
Social inflation
Social inflation remains one of the industry’s biggest challenges. A highly organized plaintiffs’ bar backed by third-party litigation financing, anti-corporate bias, and shifting theories of social responsibility and liability have combined to drive up the cost of jury verdicts and settlements and make “nuclear” verdicts — those exceeding $10 million in value — more frequent.
For the five-year period from 2018 through 2022, social inflation helped give rise to an average 16% annual increase in liability claims costs (opens a new window), according to Swiss Re. Similarly, the median nuclear verdict against corporate defendants increased from $21.5 million in 2020 to $41.1 million in 2022 (opens a new window), according to Marathon Strategies. These trends call into question both pricing and reserving accuracy.
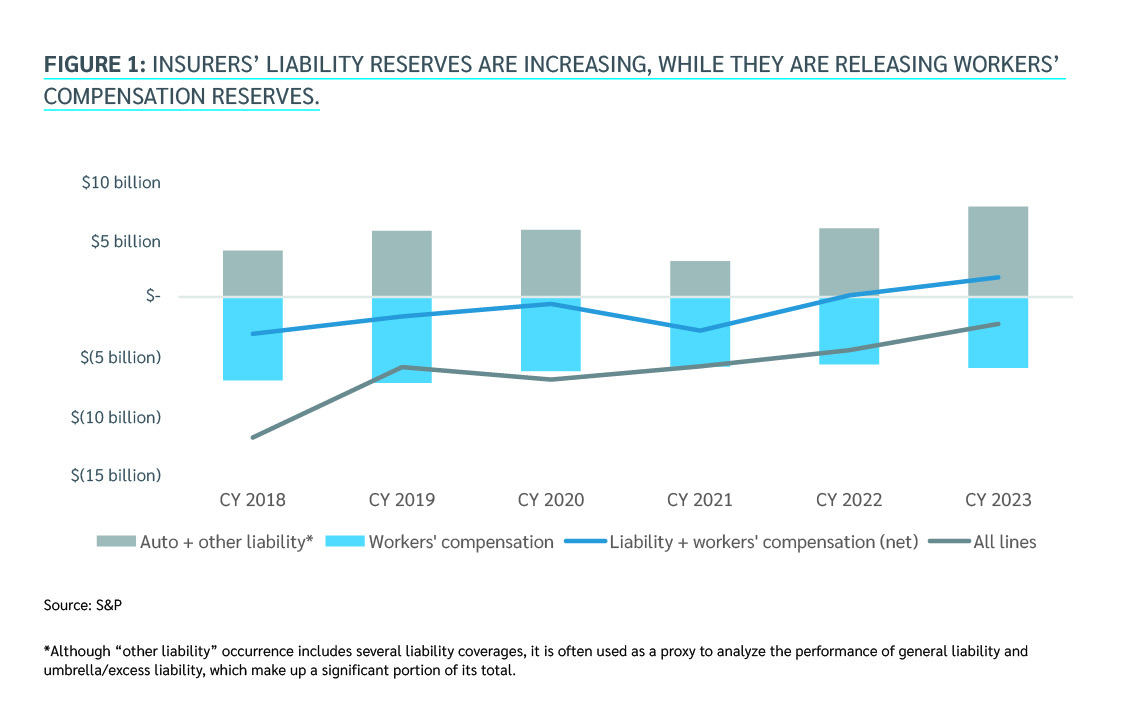
The latter, in particular, can be seen in continued adverse reserve development associated with policy years 2015 through 2019. According to S&P data, which dates back to 1996, auto liability reserve increases are the highest they’ve ever been, and “other liability” reserve increases are at their highest levels since 2005.

In Figure 1 above, reserve increases (adverse development) are shown as positive amounts while reserve decreases (favorable development) are shown as negative. Over time, the industry has been able to almost fully offset the impact of these increases thanks to consistent favorable reserve releases from workers’ compensation, shown as the “net” blue line.
But if the current trends in liability persist, can workers’ compensation releases be expected to keep pace? More to the point: Is it dangerous to count on this — or will liability lines need to stand on their own?
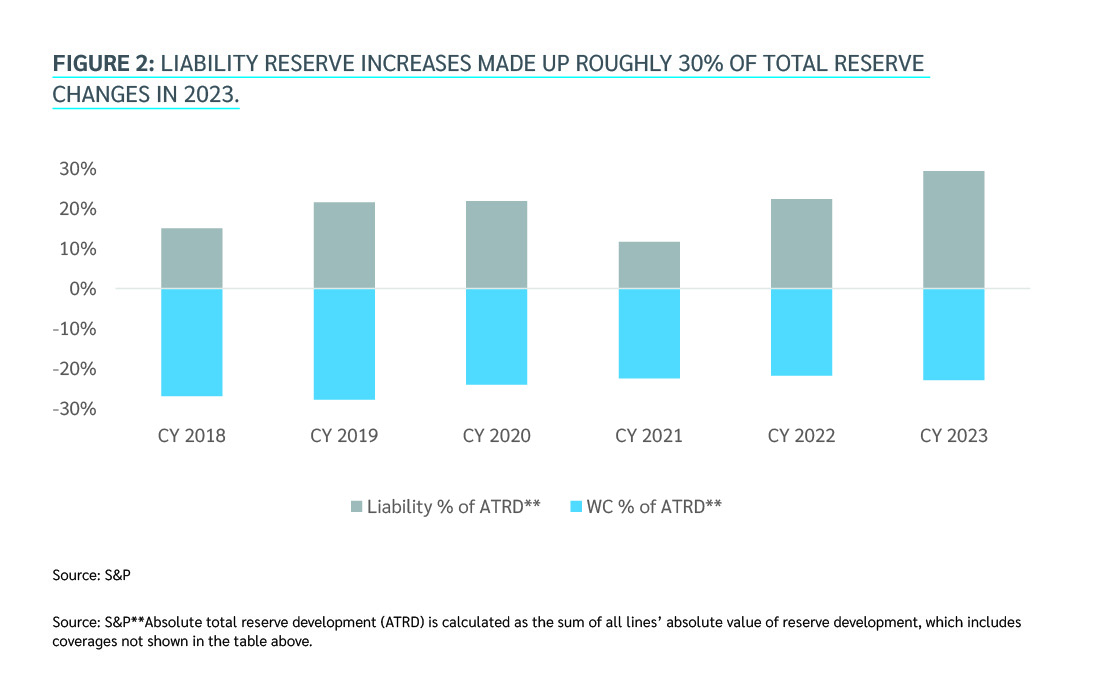
Figure 2 below sheds more light on these questions. Workers’ compensation has consistently made up 20% to 30% of total reserve changes made in the industry, while liability reserve releases had historically hovered around 10% to 20% before spiking near 30% last year.

Turning to analytics for help
With economic and social inflation still presenting twin challenges for insurers, it’s no surprise that underwriters continue to focus on attachment points, capacity, pricing and terms and conditions. Ample capacity remains, but liability insurers are determined to stay ahead of loss trends and are closely watching the litigation landscape.
An economic slowdown could add further pressure if exposures decline even as loss rates remain elevated. Insurers are also struggling to stay ahead of new risks that seem to manifest more quickly and with greater velocity than ever before. These include per- and polyfluoroalkyl substances (PFAS), biometrics, and artificial intelligence — all of which could further pressure already escalating loss trends.
Given this landscape, the key question for businesses is: How can we balance capital efficiency with our tolerance for risk and volatility? The answer may lie in analytics, which can help drive more informed decisions about insurance program structures — but only if they are used purposefully.
At Lockton, analytics isn’t just something we pay lip service to — it’s built into everything we do. Our consultants work closely with our clients to understand data, test assumptions, and provide transparency into risks and rewards. We then deliver solutions that are aligned with your corporate goals and objectives.
For example, if you have significant liability exposure, we can use our Dynamic Capital Modeling (DCM) and financial analysis tools to help you understand how likely you are to face a large claim, what various claim scenarios could cost you, and the key factors affecting your risk. We can then highlight where your assumptions may differ from insurers’, which allows us to work with you to identify areas of capital inefficiency and help find the optimal program structure to keep downside risk within your risk-bearing capacity.
Our approach uses analytics to drive conversations and create solutions, rather than using analytics to validate marketing results. That helps you build a program that provides the security and sustainability over time that you need to adequately protect your balance sheet from your most critical risks.
Explore our March 2024 Lockton Market Update (opens a new window) for more on the state of the commercial insurance market. And contact a member of your Lockton team to learn more about how analytics can help you build a more effective liability insurance program